
Page 17 - CII Artha Magazine 1
P. 17
The monthly trends also show B. LAGGARDS Faster-than-expected t a time when private
that public spending is normalisation of the US investment is not Trends in State-wise Capital Expenditure MAHARASHTRA
progressing at a rapid clip. As Consumption demand monetary stimulus forthcoming in a big way, it has MAJORITY OF Q2FY20 Q2FY21 Q2FY22 % change Q2FY22 w.r.t Q2FY20
per the latest data available on continues to move at become imperative for the Q2FY20 Q2FY21 Q2FY22 % change Q2FY22 w.r.t Q2FY20 STATES RECORD AN SHOWS WEAKNESS
CGA, capital spending for snail’s pace During the COVID-19 government to energise public INCREASE IN THEIR (In crore) (In %) IN CAPEX SPENDING
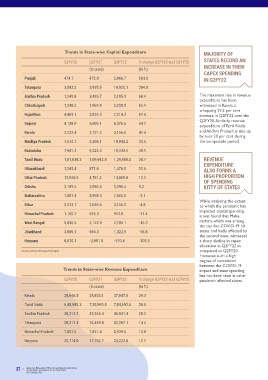
April-November FY22 stood pandemic, the US Federal investment to bring the (In crore) (In %) CAPEX SPENDING Punjab 19,533.9 20,020.0 21,638.6 10.8 IN Q2FY22 AS
at Rs 2.73 lakh crore, which is The disaggregated picture Reserve brought short-term IMPACT OF THE
13.5 per cent higher in from the demand side shows interest rates to near-zero economy back on track. And Punjab 474.7 472.0 2,866.7 503.9 IN Q2FY22 Uttar Pradesh 72,652.5 65,304.8 79,731.3 9.7
year-on-year terms and that private final consumption and restarted large-scale while the Centre has resolved Telangana 3,592.2 3,935.5 10,920.1 204.0 PANDEMIC PERSISTS
represents 49.4 per cent of expenditure (PFCE) continues bond purchases, referred to to increase its capital Gujarat 33,621.0 31,967.3 35,740.6 6.3
the budgeted spend for the to move at snail’s pace and as Quantitative Easing (QE). It expenditure significantly in Andhra Pradesh 1,249.8 3,426.7 2,105.3 68.4 The maximum rise in revenue West Bengal 47,608.5 37,646.1 50,120.3 5.3
current fiscal. Notably, it is 28.0 trails pre-pandemic levels. It helped in sharply bringing FY22, it is the states which expenditure has been
per cent higher than the same grew at a slower rate of 8.6 down the borrowing costs, need to complement the Chhattisgarh 1,348.5 1,969.4 2,230.9 65.4 witnessed in Kerala, a Chhattisgarh 17,454.8 14,785.5 18,269.1 4.7
period in the pre-pandemic per cent in the Q2FY22 as which cushioned the Centre and augment their whopping 29.3 per cent
year of 2019-20. While the compared to 19.3 per cent in economic recovery process capital investment for Rajasthan 4,469.1 3,825.3 7,214.2 61.4 increase in Q2FY22 over the Karnataka 40,620.8 31,926.5 42,299.7 4.1
progress so far has been good, the previous quarter as in the US. sustainable economic growth. At the individual level, Q2FY20. Similarly, revenue Rajasthan 44,021.6 44,986.6 45,594.2 3.6
to achieve the budgeted capital impact of a favourable base majority of states, around 70 Gujarat 4,138.0 5,606.1 6,376.6 54.1 expenditure of Tamil Nadu
expenditure of Rs 5.5 lakh effect waned. With this, the However, in his recent It is against this backdrop that per cent, have encouragingly Kerala 2,232.4 2,731.2 3,156.6 41.4 and Andhra Pradesh is also up Jharkhand 15,056.0 14,285.4 15,192.5 0.9
recorded an increase in their
TAKING STOCK heartening to note that the A. DRIVERS OF GROWTH crore, the capex push by the Sectors such as Transport In absolute terms, the consumption spending grew remarks, the Federal Reserve the section looks at the capital expenditure in the Madhya Pradesh 7,514.7 5,205.1 10,042.2 33.6 by over 20 per cent during Madhya Pradesh 37,931.4 34,131.7 38,244.0 0.8
extent to which states are
government needs to be
by 13.5 per cent in the first
the comparable period.
merchandise exports have
services, Construction &
Chair Jerome Powell has
real GDP in absolute terms at
OF THE YEAR Rs 35.7 lakh crore in the Public investment sustained. One of the ways to Real Estate, Metals & Metals reached a cumulative value half of the current fiscal. indicated that the Fed will responding to the incentives second quarter of FY22 from Karnataka 7,941.3 9,324.3 10,333.5 30.1 Maharashtra 76,666.9 74,381.6 77,297.6 0.8
the pre-pandemic levels in
However, encouragingly,
given by the Centre to
do so is to expedite the
Products and Chemicals &
continues to do the
of US$299.7 billion between
start tapering its bond
second quarter of this fiscal
9,395.4
Uttarakhand
8,422.6
-7.6
8,677.4
has crossed the pre-pandemic heavy lifting as the key projects delineated under the Chemical Products, where April-December 2021, private consumption is now purchases soon in order to improve their capital Q2FY20. Tamil Nadu 1,01,038.3 1,09,942.4 1,29,988.0 28.7 REVENUE
National Infrastructure
at 96 per cent of the
investment. For our analysis,
sustained demand recovery is
The GDP print during levels of Rs 35.6 lakh crore demand-side driver of Pipeline (NIP), which are visible, are driving the recovery in which amounts to 75 per pre-pandemic level. keep inflation in check. This is we have considered 21 Indian Among the states, Tamil Nadu EXPENDITURE Odisha 24,368.6 20,459.5 22,310.1 -8.4
the economy
Q1FY22 showed that the seen in the second quarter of nearing completion. private investment and account cent of the US$400 billion likely to have repercussions on states which account for has topped the list in capex Uttarakhand 1,209.4 871.6 1,470.9 21.6 ALSO FORMS A Bihar 34,998.1 30,087.0 28,793.9 -17.7
economy expanded by an 2019-20. An analysis of the second for nearly 62 per cent of total export target set up by the Supply-chain bottlenecks interest rates globally, thus around 94 per cent capex of spending with an outlay of Rs HIGH PROPORTION
government.
impressive 20.1 per cent - quarter of this fiscal shows Encouragingly, capital spending private investment spending by stifling growth impulses affecting foreign inflows to all states combined in FY21. 1,29,988 crore in Q2FY22 as Uttar Pradesh 12,548.6 4,791.2 14,069.0 12.1 OF SPENDING Source: CAG & CII Research Analysis
testifying that the green From supply-side basis, real that public investment has by the government across key end of third quarter. Industrial sectors such as emerging economies like India. against Rs 1,01,038 crore in the Odisha 3,109.5 2,090.4 3,396.4 9.2 KITTY OF STATES Some of the states, which
shoots of economic recovery gross value added (GVA) continued to do the heavy infrastructure sectors has engineering goods, Supply-side bottlenecks However, compared to 2013, While the resource shortfall second quarter of FY20. This is were relatively unscathed by
are slowly but surely stood at 8.5 per cent in lifting as it bounced back to remained healthy at Rs 1.81 Healthy exports also petroleum products and especially related to coal and the Fed is being more cautious may have constrained the followed by Uttar Pradesh (Rs Maharashtra 7,807.4 3,958.3 7,565.5 -3.1 Trends in Capital Expenditure of the Top 5 States Affected the Most by COVID-19 the pandemic, have also
becoming visible. However, Q2FY22 as compared to 18.8 the pre-pandemic levels in lakh crore in the period remain an enabler for organic & inorganic global shortage of in normalisation this time, 14,069 crore), Telangana (Rs While analysing the extent evidenced a decline in their
growth for the second quarter per cent in the previous Q2FY22. Gross fixed capital April-November FY22 which growth in the current fiscal chemicals have driven the semiconductors in the prioritising economic recovery 10,920 crore) and Karnataka Bihar 3,313.7 2,056.6 3,156.2 -4.8 to which the pandemic has Capital expenditure Q2FY20 Q2FY21 Q2FY22 % change Q2FY22 w.r.t Q2FY20 capex during Q2FY22 vis-a-vis
of the current fiscal (Q2FY22) quarter. formation (GFCF) was up translates into a healthy 61.7 bulk of the rise in export automobile sector affected even as inflation remains above (Rs 10,333 crore). impacted capital spending, (In crore) (In %) Q2FY20 which could be
moderated to 8.4 per cent, 11.0 per cent in the second per cent growth in Global recovery, helped by growth in this fiscal so far. the growth of the industrial the target. The impact of Fed Himachal Pradesh 1,160.2 625.3 912.0 -21.4 it was found that Maha- attributed to a general
which is primarily attributed Having taken stock of the quarter, largely supported by year-on-year terms over the rapid pace of vaccination, has Encouragingly, the sector, especially the MSMEs. taper will not be akin to the However, when estimated in West Bengal 5,036.5 2,122.9 2,705.1 -46.3 rashtra, which was among Maharashtra 7,807.4 3,958.3 7,565.5 -3.1 resource shortfall in the state.
central spending, taking
to waning of a favourable base economy, we now bucket the growth to 28.3 per cent in comparable period last year. boosted India’s external labour-intensive sector like This got mirrored in the 2013 taper tantrum episode, growth terms over the the top five COVID-19 hit Kerala 2,232.4 2,731.2 3,156.6 41.4 However, the sharpest rise in
of last year. movers and shakers of growth the first half of the current demand. Consequently, exports gems & jewellery has also passenger vehicle sales given India’s strong external pre-pandemic period of Jharkhand 3,065.1 946.3 1,322.9 -56.8 states and badly affected by
into the two broad heads of Out of the key infra sectors, have emerged as a critical declining in double digits by fundamentals, especially on the the second wave, witnessed capex is also seen in some of
DRIVERS and LAGGARDS fiscal as compared to 8.6 per Shipping, Road Transport & driver of growth in the current seen robust growth during 18.6 per cent for the third external front. Q2FY20, Punjab has witnessed Karnataka 7,941.3 9,324.3 10,333.5 30.1 the states where the pandemic
Notwithstanding, the and analyse their performance cent in the similar period in this period. the sharpest rise in capex Haryana 6,010.1 -2,051.8 -570.4 -109.5 a sharp decline in capex
deceleration in growth noted below: 2019-20. Highways, Housing & Urban fiscal. straight month in November (503.9 per cent) during allocation in Q2FY22 as Tamil Nadu 1,01,038.3 1,09,942.4 1,29,988.0 28.7 has made a limited impact.
in the second quarter, it is Affairs and Railways have so far 2021 despite strong demand High global commodity Q2FY22 followed by Telangana Source: CAG & CII Research Analysis compared to Q2FY20.
seen higher cumulative in the local market. This was prices pressurise states from spending as much However, such a high Andhra Pradesh 1,249.8 3,426.7 2,105.3 68.4 To conclude, capex spending
spending during the year as the lowest sales in seven corporate margins as projected in their budgets, (204 per cent) and Andhra degree of correlation remains a critical ingredient for
compared to last year. years for passenger vehicles. numbers show that Pradesh (68 per cent). between the COVID-19 Source: CAG & CII Research Analysis supporting the growth
Global commodity prices considerable importance has However, a few states such as Trends in State-wise Revenue Expenditure impact and state spending recovery process. While the
There are many factors have inched higher in the indeed been accorded to Haryana, West Bengal, has not been seen in other
Private capex, too, has attributable for the grave current year driven by an capital spending for meeting Jharkhand, Bihar and Q2FY20 Q2FY21 Q2FY22 % change Q2FY22 w.r.t Q2FY20 Trends in Capital Expenditure of the Bottom 5 States Relatively Unaffected by COVID-19 central government, on its
started showing signs of semiconductor shortages uptick in demand while supply the spending priorities of Maharashtra have shown a pandemic affected states. part, is pushing capital spend-
recovery as per CMIE’s being felt currently worldwide. has struggled to keep pace. In states. As compared to decline in capex during this (In crore) (In %) Capital expenditure Q2FY20 Q2FY21 Q2FY22 % change Q2FY22 w.r.t Q2FY20 ing, states are also contributing
capex data From the supply side, there 2021, commodity markets Q2FY20, at the aggregate period. Kerala 28,646.5 25,833.1 37,047.5 29.3 (In crore) (In %) by putting up a decent
are factors such as temporary have been impacted by level, states saw their capex performance so far. Going
As per CMIE’s capex data, factory closures due to the rise by 23.7 in Q2FY22 which While the big picture shows Tamil Nadu 6,48,989.3 7,35,969.5 7,84,692.6 20.9 Himachal Pradesh 1,160.2 625.3 912.0 -21.4 forward, with the threat of
private capital expenditure pandemic and disruptions in adverse weather conditions, is much higher than the 13.6 the preponderance of capital omicron virus looming large, it
(measured by the value of supply as storms halted with droughts in some parts per cent rise in revenue spending in total expenditure Andhra Pradesh 38,313.1 42,246.3 46,041.4 20.2 Jharkhand 3,065.1 946.3 1,322.9 -56.8 will be interesting to see if this
ongoing projects) stood at Rs production facilities in the US of the world affecting a few expenditure during the same of states, at the individual level,
71.7 lakh crore at the end of and Japan. The demand-side agricultural commodities and many states have reported a Telangana 28,211.4 25,459.8 32,287.1 14.4 Punjab 474.7 472.0 2,866.7 503.9 positive trend stays intact in
third quarter- higher than the factors include huge backlog reducing hydroelectricity period. A slower rise in sizeable rise in revenue the remaining quarters of the
Rs 69.27 lakh crore print seen of demand for chips due to supply while floods in other revenue expenditure has expenditure in Q2FY22 from Himachal Pradesh 7,857.5 7,851.4 8,939.6 13.8 Telangana 3,592.2 3,935.5 10,920.1 204.0 current fiscal as well.
in the same period in FY21 and the release of pent-up demand areas has impacted the supply helped to contain the rise in Uttarakhand 1,209.4 871.6 1,470.9 21.6
Rs 69.39 lakh crore seen in the amongst others. of certain metals and coal. total expenditure to 14.9 per the pre-pandemic period as Haryana 20,714.0 17,762.7 23,222.0 12.1
pre-pandemic period of FY20. cent in Q2FY22 over Q2FY20. well. Source: CAG & CII Research Analysis
17 ANALYSIS, RESEARCH, THOUGHT LEADERSHIP & ADVOCACY ANALYSIS, RESEARCH, THOUGHT LEADERSHIP & ADVOCACY 18
QUARTERLY JOURNAL OF ECONOMICS
QUARTERLY JOURNAL OF ECONOMICS
DECEMBER 2021 DECEMBER 2021
B. Deepening the supported CAS (conditional
Component Value Chain access system) for set top
across the entire boxes.
ecosystem
Similarly, a global innovation
The domestic electronics challenge for designing of
industry is characterised by semiconductors and chip sets
lack of a component for educational tablets for the
ecosystem which leads to its masses could be encouraged.
dependence on imports. High
dependency on imported Besides, the next focus should
inputs raises cost and impedes be on maximizing domestic
competitiveness. A right mix value addition and promoting
of policy realignment coupled Design in India, besides Make
with new targets is required. in India. For this, the
know-how available with
The government has, no doubt Government owned R&D
announced the PLI scheme for laboratories should be made
components. However, the 5-6 freely accessible to industry,
per cent incentive on outsourced R&D needs to be
incremental sales, envisaged incentivized on the lines of
under the scheme, is not In-house R&D, Technology
enough to achieve scale in this Acquisition Fund be created
sector and accordingly would for liberal assistance in filing
discourage manufacturers patents and a Guarantee Fund
from indigenizing production. be created to help R&D
Hence, the government should houses to raise working
review the scheme by capital.
expanding the incentive from
the present 5-6 per cent and D. Other Suggestions
widen the eligibility criteria. A
revamped PLI would facilitate Similarly, the government
scale economies from should also look at other
domestic production and also options such as leveraging
encourage SMEs to strengthen upcoming FTAs (UK & the
the supply chain and reduce EU) towards enhancing
our dependence on imports. exports, incentivizing
manufacture of products not
C. Encouraging Design-led currently produced in India,
Manufacturing facilitating EoDB, among
others.
For ensuring that the industry
remains competitive (by To conclude, a robust policy
facilitating domestic IP environment would help the
creation), even after the PLI & country to realise the huge
other benefits expire, a push opportunity awaiting India to
to R&D is most essential. For emerge as a global hub for
this, the government should electronics and meet the
explore innovative solutions targets envisioned in the NPE
for the sector such as a model 2019.
based on the Government led
domestic manufacturers