Page 13 - CII Artha Magazine 1
P. 13

The monthly trends also show                                                                 B. LAGGARDS                Faster-than-expected
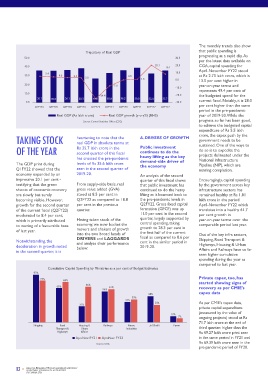
                                       Trajectory of Real GDP                            that public spending is                              Trends in Private Capital Expenditure                              normalisation of the US
                                                                                         progressing at a rapid clip. As                                                              Consumption demand         monetary stimulus
            50.0                                                               30.0                                                          (Value of Ongoing Projects*, Rs lakh crore)
                                                                                         per the latest data available on           72.0                                  71.77       continues to move at
            40.0                                                      20.1  8.4  20.0    CGA, capital spending for                                                                    snail’s pace               During the COVID-19
                     5.4                                                       10.0      April-November FY22 stood                  71.0                                                                         pandemic, the US Federal
            30.0           4.6    3.3  3.0                0.5   1.6            0.0       at Rs 2.73 lakh crore, which is                                                              The disaggregated picture   Reserve brought short-term
            20.0                                   -7.4                                  13.5 per cent higher in                    70.0                                              from the demand side shows   interest rates to near-zero
                                                                                                                                                                                      that private final consumption
                                                                                         year-on-year terms and
                                                                               -10.0                                                                                                                             and restarted large-scale
                                                                                         represents 49.4 per cent of                      69.39           69.27                       expenditure (PFCE) continues   bond purchases, referred to
            10.0
                                             -24.4                             -20.0     the budgeted spend for the                 69.0                                              to move at snail’s pace and   as Quantitative Easing (QE). It
                  35.7  35.6  36.1  38.3  27.0   33.0  36.2  39.0  32.4  35.7
             0.0                                                               -30.0     current fiscal. Notably, it is 28.0                                                          trails pre-pandemic levels. It   helped in sharply bringing
                 Q1FY20  Q2FY20  Q3FY20  Q4FY20  Q1FY21  Q2FY21  Q3FY21  Q4FY21  Q1FY22  Q2FY22  per cent higher than the same      68.0                                              grew at a slower rate of 8.6   down the borrowing costs,
                                                                                         period in the pre-pandemic                     Apr-Dec FY20    Apr-Dec FY21    Apr-Dec FY22  per cent in the Q2FY22 as   which cushioned the
                          Real GDP (Rs lakh crore)  Real GDP growth (y-o-y%) (RHS)       year of 2019-20. While the                            Source: CII analysis using CMIE CAPEX database  compared to 19.3 per cent in   economic recovery process
                                                                                         progress so far has been good,                  Note: *Ongoing projects = Outstanding projects - Implementation stalled  the previous quarter as
                                      Source: Central Statistics Office (CSO)                                                                                                                                    in the US.
                                                                                         to achieve the budgeted capital                                                              impact of a favourable base
                                                                                         expenditure of Rs 5.5 lakh                                                                   effect waned. With this, the   However, in his recent
        TAKING STOCK               heartening to note that the   A. DRIVERS OF GROWTH    crore, the capex push by the          Sectors such as Transport   In absolute terms, the     consumption spending grew   remarks, the Federal Reserve
                                                                                         government needs to be
                                                                                                                                                                                      by 13.5 per cent in the first
                                                                                                                                                           merchandise exports have
                                                                                                                               services, Construction &
                                                                                                                                                                                                                 Chair Jerome Powell has
                                   real GDP in absolute terms at
        OF THE YEAR                Rs 35.7 lakh crore in the   Public investment         sustained. One of the ways to         Real Estate, Metals & Metals   reached a cumulative value   half of the current fiscal.   indicated that the Fed will
                                                                                                                                                                                      However, encouragingly,
                                                                                         do so is to expedite the
                                                                                                                               Products and Chemicals &
                                                                                                                                                           of US$299.7 billion between
                                                               continues to do the
                                                                                                                                                                                                                 start tapering its bond
                                   second quarter of this fiscal
                                   has crossed the pre-pandemic   heavy lifting as the key   projects delineated under the     Chemical Products, where    April-December 2021,       private consumption is now   purchases soon in order to
                                                                                                                                                                                      at 96 per cent of the
                                                                                         National Infrastructure
                                                                                                                               sustained demand recovery is
        The GDP print during       levels of Rs 35.6 lakh crore   demand-side driver of   Pipeline (NIP), which are            visible, are driving the recovery in   which amounts to 75 per   pre-pandemic level.   keep inflation in check.  This is
                                                               the economy
        Q1FY22 showed that the     seen in the second quarter of                         nearing completion.                   private investment and account   cent of the US$400 billion                       likely to have repercussions on
        economy expanded by an     2019-20.                    An analysis of the second                                       for nearly 62 per cent of total   export target set up by the   Supply-chain bottlenecks   interest rates globally, thus
                                                                                                                                                           government.
        impressive 20.1 per cent -                             quarter of this fiscal shows   Encouragingly, capital spending   private investment spending by                        stifling growth impulses   affecting foreign inflows to
        testifying that the green   From supply-side basis, real   that public investment has   by the government across key   end of third quarter.       Industrial sectors such as                            emerging economies like India.
        shoots of economic recovery   gross value added (GVA)   continued to do the heavy   infrastructure sectors has                                     engineering goods,         Supply-side bottlenecks    However, compared to 2013,
        are slowly but surely      stood at 8.5 per cent in    lifting as it bounced back to   remained healthy at Rs 1.81     Healthy exports also        petroleum products and     especially related to coal and   the Fed is being more cautious
        becoming visible. However,   Q2FY22 as compared to 18.8   the pre-pandemic levels in   lakh crore in the period        remain an enabler for       organic & inorganic        global shortage of         in normalisation this time,
        growth for the second quarter   per cent in the previous   Q2FY22. Gross fixed capital   April-November FY22 which     growth in the current fiscal    chemicals have driven the   semiconductors in the   prioritising economic recovery
        of the current fiscal (Q2FY22)   quarter.              formation (GFCF) was up   translates into a healthy 61.7                                    bulk of the rise in export   automobile sector affected   even as inflation remains above
        moderated to 8.4 per cent,                             11.0 per cent in the second   per cent growth in                Global recovery, helped by   growth in this fiscal so far.   the growth of the industrial   the target. The impact of Fed
        which is primarily attributed   Having taken stock of the   quarter, largely supported by   year-on-year terms over  the   rapid pace of vaccination, has   Encouragingly, the   sector, especially the MSMEs.    taper will not be akin to the
                                                               central spending, taking
        to waning of a favourable base   economy, we now bucket the   growth to 28.3 per cent in   comparable period last year.   boosted India’s external   labour-intensive sector like   This got mirrored in the   2013 taper tantrum episode,
        of last year.              movers and shakers of growth   the first half of the current                                demand. Consequently, exports   gems & jewellery has also   passenger vehicle sales   given India’s strong external
                                   into the two broad heads of                           Out of the key infra sectors,         have emerged as a critical                             declining in double digits by   fundamentals, especially on the
                                   DRIVERS and LAGGARDS        fiscal as compared to 8.6 per   Shipping, Road Transport &      driver of growth in the current   seen robust growth during   18.6 per cent for the third   external front.
        Notwithstanding, the       and analyse their performance   cent in the similar period in                                                           this period.
        deceleration in growth noted   below:                  2019-20.                  Highways, Housing & Urban             fiscal.                                                straight month in November
        in the second quarter, it is                                                     Affairs and Railways have so far                                                             2021 despite strong demand   High global commodity
                                                                                         seen higher cumulative                                                                       in the local market. This was   prices pressurise
                                                                                         spending during the year as                                                                  the lowest sales in seven   corporate margins
                                                                                         compared to last year.                                                                       years for passenger vehicles.
                      Cumulative Capital Spending by Ministries as a per cent of Budget Estimates                                         Merchandise Exports Performance (US$ billion)                          Global commodity prices
                93%                                                                                                                                                                   There are many factors     have inched higher in the
                   73%       68%                                                         Private capex, too, has                  313.4   291.8                               299.7     attributable for the grave   current year driven by an
                                       66%                                               started showing signs of                                                        263.7        semiconductor shortages    uptick in demand while supply
                          65%                    61%                                     recovery as per CMIE’s                                                     233.8
                                               56%                                                                                                                                    being felt currently worldwide.   has struggled to keep pace. In
                                                                   44%                   capex data                                                            198.2                  From the supply side, there   2021, commodity markets
                                                            39%                                                                                           164.4
                                                         37%                                                                                          131.0                           are factors such as temporary   have been impacted by
                                    31%                               34%                As per CMIE’s capex data,                                 95.5                               factory closures due to the   adverse weather conditions,

                                                                                         private capital expenditure                         63.0                                     pandemic and disruptions in
                                                                                         (measured by the value of                                                                                               with droughts in some parts
                                                                             10%                                                           30.7                                       supply as storms halted
                                                                                7%       ongoing projects) stood at Rs                                                                production facilities in the US   of the world affecting a few
                                                                                         71.7 lakh crore at the end of            FY20  FY21  April  May  June  July  August September October November December  and Japan.  The demand-side   agricultural commodities and
                Shipping    Road    Housing &  Railways   Heavy    Jal Shakti  Power                                                       2021  2021  2021  2021  2021  2021  2021  2021  2021                  reducing hydroelectricity
                          Transport &  Urban             Industries                      third quarter- higher than the                                                               factors include huge backlog
                           Highways  Affairs                                             Rs 69.27 lakh crore print seen                         Source: Ministry of Commerce & Industry  of demand for chips due to   supply while floods in other
                                   Apr-Nov FY21  Apr-Nov FY22                            in the same period in FY21 and                                                               the release of pent-up demand   areas has impacted the supply
                                                                                         Rs 69.39 lakh crore seen in the                                                                                         of certain metals and coal.
                                            Source: CGA                                                                                                                               amongst others.
                                                                                         pre-pandemic period of FY20.
        13   ANALYSIS, RESEARCH, THOUGHT LEADERSHIP & ADVOCACY                                                                                                                                               ANALYSIS, RESEARCH, THOUGHT LEADERSHIP & ADVOCACY  14
                                                                                                                                                                                                                  QUARTERLY JOURNAL OF ECONOMICS
             QUARTERLY JOURNAL OF ECONOMICS
             DECEMBER 2021                                                                                                                                                                                                  DECEMBER 2021
   8   9   10   11   12   13   14   15   16   17   18